What Is a Gross Rent Multiplier? Key Real Estate Metric
What Is a Gross Rent Multiplier? Key Real Estate Metric
Discover what is a gross rent multiplier and how to use it to evaluate real estate deals quickly. Learn how to calculate GRM effectively.
Domingo Valadez
Sep 30, 2025
Blog
If you've ever sifted through dozens of real estate listings, you know how overwhelming it can be. This is where a handy little tool called the Gross Rent Multiplier (GRM) comes in. Think of it as a quick, back-of-the-napkin calculation that helps you compare the value of different income-producing properties.
In essence, GRM tells you how many years it would take for a property's gross rental income to cover its purchase price. It’s a fast-pass to screen potential deals and see which ones are worth a closer look.
Breaking Down the Gross Rent Multiplier

Let's use an analogy. Imagine you're at a farmers market looking at two different baskets of apples. One is $20, and the other is $30. Just based on price, you can't tell which is the better bargain. But what if you learn the first basket has 10 apples and the second has 20? Suddenly, it's clear the second basket gives you more bang for your buck.
The Gross Rent Multiplier does the same thing for real estate. It creates a "price per dollar of rent" metric, allowing you to compare properties of different sizes and price points on a more level playing field. It's not a deep dive, but it's a powerful first-glance tool for spotting potential bargains.
A First Look, Not the Final Word
Think of GRM as your initial screening filter. When you're staring at a long list of potential investments, you don’t have time to build a detailed financial model for every single one. GRM helps you quickly weed out properties that are obviously overpriced relative to their rental income and flag the promising ones for a more thorough investigation.
It's critical to remember what GRM is—and what it isn't:
- It Is: A quick calculation to compare a property's price against its gross rents.
- It Is Not: A measure of profitability or cash flow, because it completely ignores operating expenses like taxes, insurance, and maintenance.
A lower GRM often points to a more attractive investment. Why? Because it means the property's price is lower in proportion to the rent it brings in, suggesting you'll recoup the purchase price (from gross rent) in fewer years.
The whole point of using GRM is efficiency. It boils the initial comparison down to a single, simple number, helping you cut through the noise and focus your time and energy on analyzing the deals with real potential. We'll get into its limitations later, but for now, just know it's an indispensable first step in any savvy investor's process.
How to Calculate the Gross Rent Multiplier

One of the biggest advantages of the Gross Rent Multiplier is its sheer simplicity. You don't need a sophisticated financial model or complex software to get a quick feel for a property's value. You just need two numbers and a simple formula.
This calculation is all about speed. It helps you quickly sift through a long list of potential deals, letting you zero in on the properties that actually deserve a closer, more detailed look.
The GRM Formula
The formula itself is refreshingly straightforward. All you need is the property's market price and its total rental income for the year.
Gross Rent Multiplier = Market Value / Gross Annual Rent
The number you get tells you how many years it would take for the property's gross rent to cover its purchase price. Keep in mind, this is a top-line metric. It's a measure of revenue potential, not true profitability, because it doesn't account for operating expenses.
Let’s walk through a couple of practical examples to see how it works in the real world.
Example 1: The Single-Family Rental
Let's say you're looking at a single-family home with a price tag of $320,000. The property is currently rented for $2,500 per month.
- Step 1: Find the Gross Annual Rent. First, you need to turn that monthly figure into a yearly one.$2,500 (monthly rent) x 12 months = $30,000 (gross annual rent)
- Step 2: Plug it into the GRM Formula. Now, divide the home's price by the annual rent.$320,000 (market value) / $30,000 (gross annual rent) = 10.67
The GRM for this house is 10.67. This essentially means it would take just under 11 years of collecting rent (before any expenses) to pay back the purchase price.
Example 2: The Duplex
Now, let's look at a duplex in the same area. This property is on the market for $450,000, and it has two units, each renting for $1,600 per month.
- Step 1: Calculate the Gross Annual Rent. First, figure out the total monthly income, then make it annual.$1,600 (rent per unit) x 2 units = $3,200 (total monthly rent)$3,200 x 12 months = $38,400 (gross annual rent)
- Step 2: Apply the GRM Formula. Divide the duplex's asking price by its total annual rent.$450,000 (market value) / $38,400 (gross annual rent) = 11.72
The duplex has a GRM of 11.72. Even though it brings in more cash flow, its higher purchase price gives it a slightly higher GRM than the single-family home. This simple comparison immediately lets you start asking smarter questions about which property might be the better value.
This metric is incredibly useful for investors trying to figure out bidding prices or just quickly gauge if an asking price is in the right ballpark. For example, a small multifamily property with an asking price of $300,000 generating a total of $43,200 in gross rent per year would have a GRM of 6.95 ($300,000 ÷ $43,200). This tells an investor it would take nearly seven years of gross rent to cover the price, which might be a great deal depending on the market. You can dive deeper into how investors use GRM at Stessa.com.
What Is a Good Gross Rent Multiplier?

So, you’ve got the formula down. The next logical question every investor asks is, "What's a good Gross Rent Multiplier?"
The short answer? It depends. There’s simply no magic number that works for every property in every city. A GRM is completely dependent on the context of the local market, the type of property, and the current economic climate.
Think of it this way: what’s a “good” price for a cup of coffee? The answer is very different if you’re at a roadside diner in rural Kansas versus a five-star hotel in midtown Manhattan. The same logic applies to GRM. A fantastic number in one market could be a major warning sign in another.
Why a Lower GRM Is Generally Better
As a general rule, most investors are hunting for a lower GRM. A smaller number means the property's price is low relative to the rent it brings in. From a purely top-line perspective, this points to a faster payback period on your investment.
In many markets, a GRM between 4 and 7 is considered pretty strong, showing a healthy balance between the property's cost and its rental income. On the flip side, a GRM creeping above 10 might suggest the property is overvalued for the rent it can command.
But these are just guideposts, not gospel. A suspiciously low GRM could also mean the property needs a ton of work or is located in a high-risk area. It’s a signal to dig deeper, not a guarantee of a great deal.
The Power of Local Market Context
The real value of GRM shines when you use it as a comparative tool within a specific, well-defined market. The Gross Rent Multiplier is a quick way to gauge a property's value by looking at its price versus its gross rent. You’ll see this play out dramatically across different types of markets.
For instance, mature, high-demand markets like New York often have GRMs between 8 and 12 because property values are so high. In contrast, you might see GRMs north of 20 or 30 in some emerging markets where the path to profitability is much longer. You can explore more about how this metric varies on Wikipedia's GRM page.
This huge variance is precisely why a "good" GRM is always a local number. To use it effectively, you need to figure out the baseline for your specific investment area.
- Analyze the Comps: Start by pulling data on similar rental properties that have recently sold in your target neighborhood.
- Calculate Their GRMs: Run the numbers for at least 5-10 comparable properties to get a solid sample size.
- Establish a Benchmark: Find the average GRM for that micro-market. This is your new yardstick.
Once you have this benchmark, you have a powerful new filter. Any new listing that comes up with a GRM well below your benchmark average is worth a much closer look. And any property with a GRM that’s way too high? You can probably set it aside and move on. It’s a simple but incredibly effective way to spot potential value and avoid overpriced deals.
The Good, The Bad, and The GRM
The Gross Rent Multiplier is a fantastic tool, but you have to know what it’s for. Think of it like a first-glance appraisal. It’s perfect for quickly sorting a long list of potential deals, but making a final decision based on GRM alone would be like buying a car just because you like the paint job—it tells you nothing about what’s going on under the hood.
To use GRM effectively, you need a solid grasp of what it does well and, more importantly, where it falls short. It's an excellent starting point for your analysis, but it should never be the finish line.
Why You'll Like Using the Gross Rent Multiplier
The main reason investors love the GRM is its sheer simplicity and speed. When you're sifting through dozens, or even hundreds, of properties, you need a way to quickly separate the contenders from the duds.
- It’s Fast: You only need two numbers: the property's price and its gross annual rent. With those, you can calculate the GRM in seconds. This lets you fly through a list of potential investments without getting bogged down in complicated spreadsheets.
- It’s Great for Quick Comparisons: GRM creates a simple, standardized metric. This makes it incredibly easy to line up several properties and see how they stack up against one another based on one question: "Which one has a lower price relative to the rent it pulls in?"
- The Data is Easy to Find: You don't need a seller's full financial records to run this calculation. The asking price is public, and the gross rent is usually right there in the listing or can be estimated fairly accurately.
This is what makes the GRM the perfect first filter. It helps you quickly flag the properties that are actually worth your time for a deeper financial dive.
The Major Blind Spots of GRM
The very simplicity that makes the GRM so useful is also its biggest weakness. To achieve that speed, it has to ignore the most critical factor for profitability: operating expenses.
A property's true value isn't just about the rent it brings in; it's about how much of that rent you actually get to keep. GRM provides a dangerously incomplete picture because it treats all gross rental dollars as equal.
This oversight can be seriously misleading. While the Gross Rent Multiplier is a handy comparative tool, industry experts often caution that it completely overlooks costly items like property taxes, insurance, repairs, and vacancies—all of which can take a huge bite out of your cash flow. You can find more expert insights on how these exclusions affect net returns on the Trion Properties website.
Let’s look at a real-world example. Imagine two nearly identical duplexes, side-by-side, both listed for $500,000. Each one generates $50,000 in gross annual rent.
- A quick calculation shows both properties have a GRM of 10 ($500,000 / $50,000).
Based on the GRM, they look like the exact same investment. But what if Duplex A is brand new, with low maintenance and annual property taxes of $5,000? Meanwhile, Duplex B is an older building with a leaky roof, an ancient HVAC system, and property taxes of $10,000.
Suddenly, the picture changes. Duplex A's total operating expenses might only be $15,000, leaving you with $35,000 in net income. Duplex B, on the other hand, could easily have $25,000 in expenses, leaving just $25,000 in your pocket.
They have the same GRM, but Duplex A is wildly more profitable. That’s the critical blind spot of the Gross Rent Multiplier.
GRM vs. Cap Rate and Other Key Metrics
While the Gross Rent Multiplier is a fantastic tool for a quick first look, relying on it alone is like judging a car by its paint job. It gives you a general idea, but you're missing what’s under the hood. To really understand a property's financial health, you need to bring in more powerful metrics, and the most important of these is the Capitalization Rate, or Cap Rate.
Think of it this way: GRM looks at a property's potential based on its total possible rent, while Cap Rate digs into its actual, real-world profitability. The crucial difference comes down to one thing: GRM uses gross rent, but Cap Rate is built on Net Operating Income (NOI). NOI is the money left over after you've paid all the bills—property taxes, insurance, maintenance, you name it—but before you’ve paid the mortgage.
Because it factors in these crucial expenses, the Cap Rate gives you a much truer picture of the return you can expect from the investment.
A Head-to-Head Comparison
The best way to get a feel for how these two metrics work is to see them in action. The GRM answers a simple question: "If I collected every dollar of rent, how many years would it take to pay off the property's purchase price?" The Cap Rate, on the other hand, asks, "What is the annual return on this investment if I bought it with all cash?"
GRM: The Quick Filter. This is your go-to for rapidly sorting through a long list of potential deals. It helps you quickly spot properties that seem reasonably priced based on the rent they bring in.
Cap Rate: The Profitability Test. Once you have a shortlist, you use the Cap Rate to see which properties will actually generate the most profit after all the operating costs are paid.
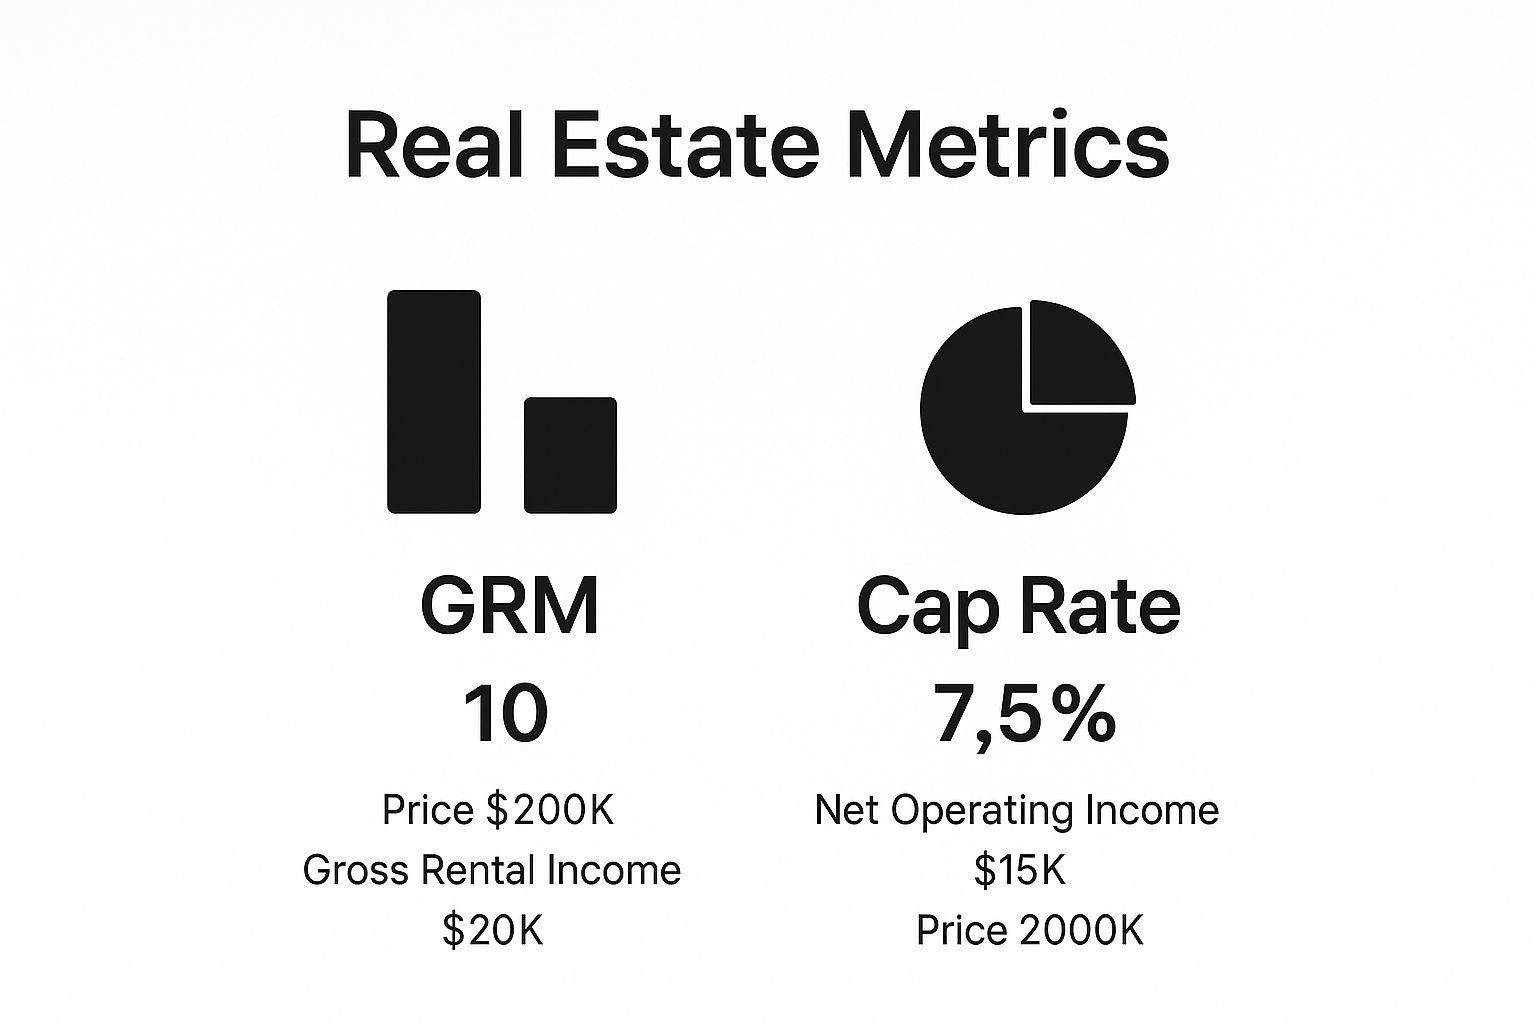
Let's look at how these two metrics would size up the same property—one priced at $200,000.

As you can see, the GRM offers a simple timeline based on gross income. But the Cap Rate reveals the property's actual yearly return once you account for the real costs of owning and operating it.
To help clarify the unique roles of these metrics, here's a quick comparison of the most common tools in an investor's kit.
Comparison of Key Real Estate Metrics
Understanding the differences between Gross Rent Multiplier, Cap Rate, and Cash-on-Cash Return.
Each of these metrics tells a different part of the story. A seasoned investor knows how to use them together to build a complete financial picture and make smarter decisions.
Layering Metrics for a Smarter Analysis
Ultimately, it’s not about which metric is "better." It's about using the right tool for the right job. A smart investor’s workflow usually involves layering these analyses, moving from broad to specific.
- Start Broad with GRM: Quickly scan dozens of listings in your target market. Use GRM to weed out the obviously overpriced deals and build a manageable shortlist.
- Dig Deeper with Cap Rate: Now, for the properties on your shortlist, it's time to do some homework. You'll need to get the operating expense numbers to calculate the NOI and the Cap Rate. You can learn more about this process in our guide on how to calculate Cap Rate for a rental property.
- Get Personal with Cash-on-Cash Return: The final step is to look at the deal through the lens of your own finances. The Cash-on-Cash Return shows you the return on your down payment after accounting for your mortgage. It’s the most personal of all the metrics.
By layering these metrics, you methodically move from a high-level scan of the market to a detailed analysis of a specific deal that works for you. This process ensures you're not just chasing a property with good-looking numbers, but finding an investment that truly aligns with your financial goals.
Putting the GRM to Work in Your Investment Strategy
Alright, so you’ve got the theory down. Now, let’s talk about how to actually use the Gross Rent Multiplier in a real-world workflow. The trick isn't to treat this number as the final word on a deal, but to use it as a quick, effective tool that makes your property search way more efficient. A smart strategy turns this simple calculation into a powerful first-pass filter.
First things first: you need a local benchmark. Before you even start scrolling through listings, do a little homework on the average GRM for the specific neighborhood and property type you’re targeting. Look at 5-10 recent, comparable sales to get a solid baseline. This number becomes your ruler for measuring value.
A Practical Workflow for Finding Deals
Once you have that benchmark number in your back pocket, you can start sorting through new listings like a pro. Any property you see with a GRM that’s noticeably below your market average should immediately jump to the top of your list for a closer look. On the flip side, you can quickly move on from properties with a much higher GRM, saving yourself a ton of time.
This gives you a clear, repeatable process:
- Set Your Benchmark: Figure out the average GRM for your target area.
- Screen New Listings: Run a quick GRM calculation for every property that catches your eye.
- Flag the Winners: Isolate the properties with unusually low GRMs. These are your potential deals.
- Dig Deeper: For the properties you’ve flagged, now it’s time to run the more detailed numbers, like Cap Rate and Cash-on-Cash Return.
Think of the GRM as a bouncer for your time and energy. Its job is to let the promising deals through the door while keeping the duds out, ensuring you only spend your valuable analysis time on opportunities that have already passed a basic sniff test.
For anyone just starting out, getting a handle on metrics like GRM is one of the most important things to consider before getting into real estate investing. Mastering this initial screening step keeps you from getting overwhelmed and helps you zero in on the deals that actually have potential.
Got Questions About GRM? You're Not Alone.
Even after you get the hang of the Gross Rent Multiplier, a few common questions always seem to pop up when you start putting it to work. Let's tackle some of the most frequent ones so you can use this tool with confidence.
Can I Use GRM for Commercial Properties?
Technically, yes, but you really shouldn't lean on it. For commercial real estate—think office buildings, retail spaces, or industrial warehouses—the Cap Rate is the industry standard for a reason.
Commercial properties have a much heavier and more complex expense load that GRM completely glosses over. Using GRM for a commercial deal is like judging a car's performance just by its paint job. It's a quick first glance at best, but you need to pop the hood and dig into a full financial analysis to see what's really going on.
Does a Low GRM Always Mean a Good Investment?
Not at all. A low GRM is a fantastic signal—it’s a flashing light telling you to dig deeper. But it's definitely not a guarantee of a great investment on its own. It just means the property's price looks cheap compared to the rent it brings in.
So, why might it be so cheap? There could be a catch. Maybe the property needs a new roof and HVAC system, or the property taxes are sky-high. Perhaps it's in a neighborhood that's trending downward. A low GRM is your invitation to start the real due diligence, not the finish line.
How Do I Find the Average GRM for My Area?
The only way to get a number you can trust is to do the homework yourself. National averages are useless here; real estate is hyper-local.
Here’s a quick process to build your own reliable benchmark:
- Find Comps: Pull a list of 5-10 similar rental properties that sold recently in the exact neighborhood you're targeting.
- Collect the Numbers: You'll need the final sales price and the gross annual rent for each property. A good local real estate agent can be your best friend here, but real estate portals can also provide this data.
- Do the Math: Calculate the GRM for each individual property and then average them all together.
This little bit of legwork gives you a powerful benchmark. You’ll know exactly what a "typical" GRM looks like in your market, making it much easier to spot a deal that truly stands out.
Juggling investor questions and deal metrics can feel like a full-time job. Homebase is designed to simplify that chaos by putting your fundraising, investor relations, and deal management all in one place. You can get back to what you do best—finding great deals. Discover how Homebase can help you scale your real estate syndication business.
Share On Linkedin
Share On Twitter
Share On Linkedin
Share On Twitter
DOMINGO VALADEZ is the co-founder at Homebase and a former product strategy manager at Google.
What To Read Next
A Guide to Real Estate Financial Modelling for Syndicators
Blog
Master real estate financial modelling with this guide. Learn to build models that analyze deals, forecast returns, and build unwavering investor confidence.
Sign up for the newsletter
If you want relevant updates from our team at Homebase, sign up! Your email is never shared.
Sign up for the newsletter
If you want relevant updates from our team at Homebase, sign up! Your email is never shared.
© 2026 Homebase. All rights reserved.